TheSu XML annotations produce machine-readable data that can be processed in whatever way best serves a researcher's needs. The thesis-support relationships and proposition-based connections naturally form network structures, which can be converted into various formats and visualised using different tools and approaches.

This page presents example visualisation designs developed by the author to demonstrate useful ways of representing TheSu XML data. These designs are planned for inclusion in the future TheSu Annotator GUI and web platforms for accessing and searching TheSu annotations. However, they represent only one possible approach—researchers are free to develop their own visualisation methods tailored to their specific research questions.

Source Dataset

All visualisation examples on this page are drawn from a dataset to be published alongside the following paper:

Lead White in Context Across Greco-Roman Sources: The First TheSu XML Annotation Dataset of Arguments and Recipes, with Graph Visualisations and Discussion of their Design

Author: Daniele Morrone · Journal: Journal of Open Humanities Data · Collection: Data-Driven History of Ideas

Under Peer Review Invited full submission following abstract selection (June 2024); submitted June 2025

Two Complementary Designs

The author's approach proposes two complementary visualisation designs, each serving different analytical purposes. This dual strategy allows researchers to move between close and distant reading methods—examining individual arguments in detail while also identifying patterns across larger corpora.

Detailed Argumentation Maps

Purpose: Close reading and individual argument analysis

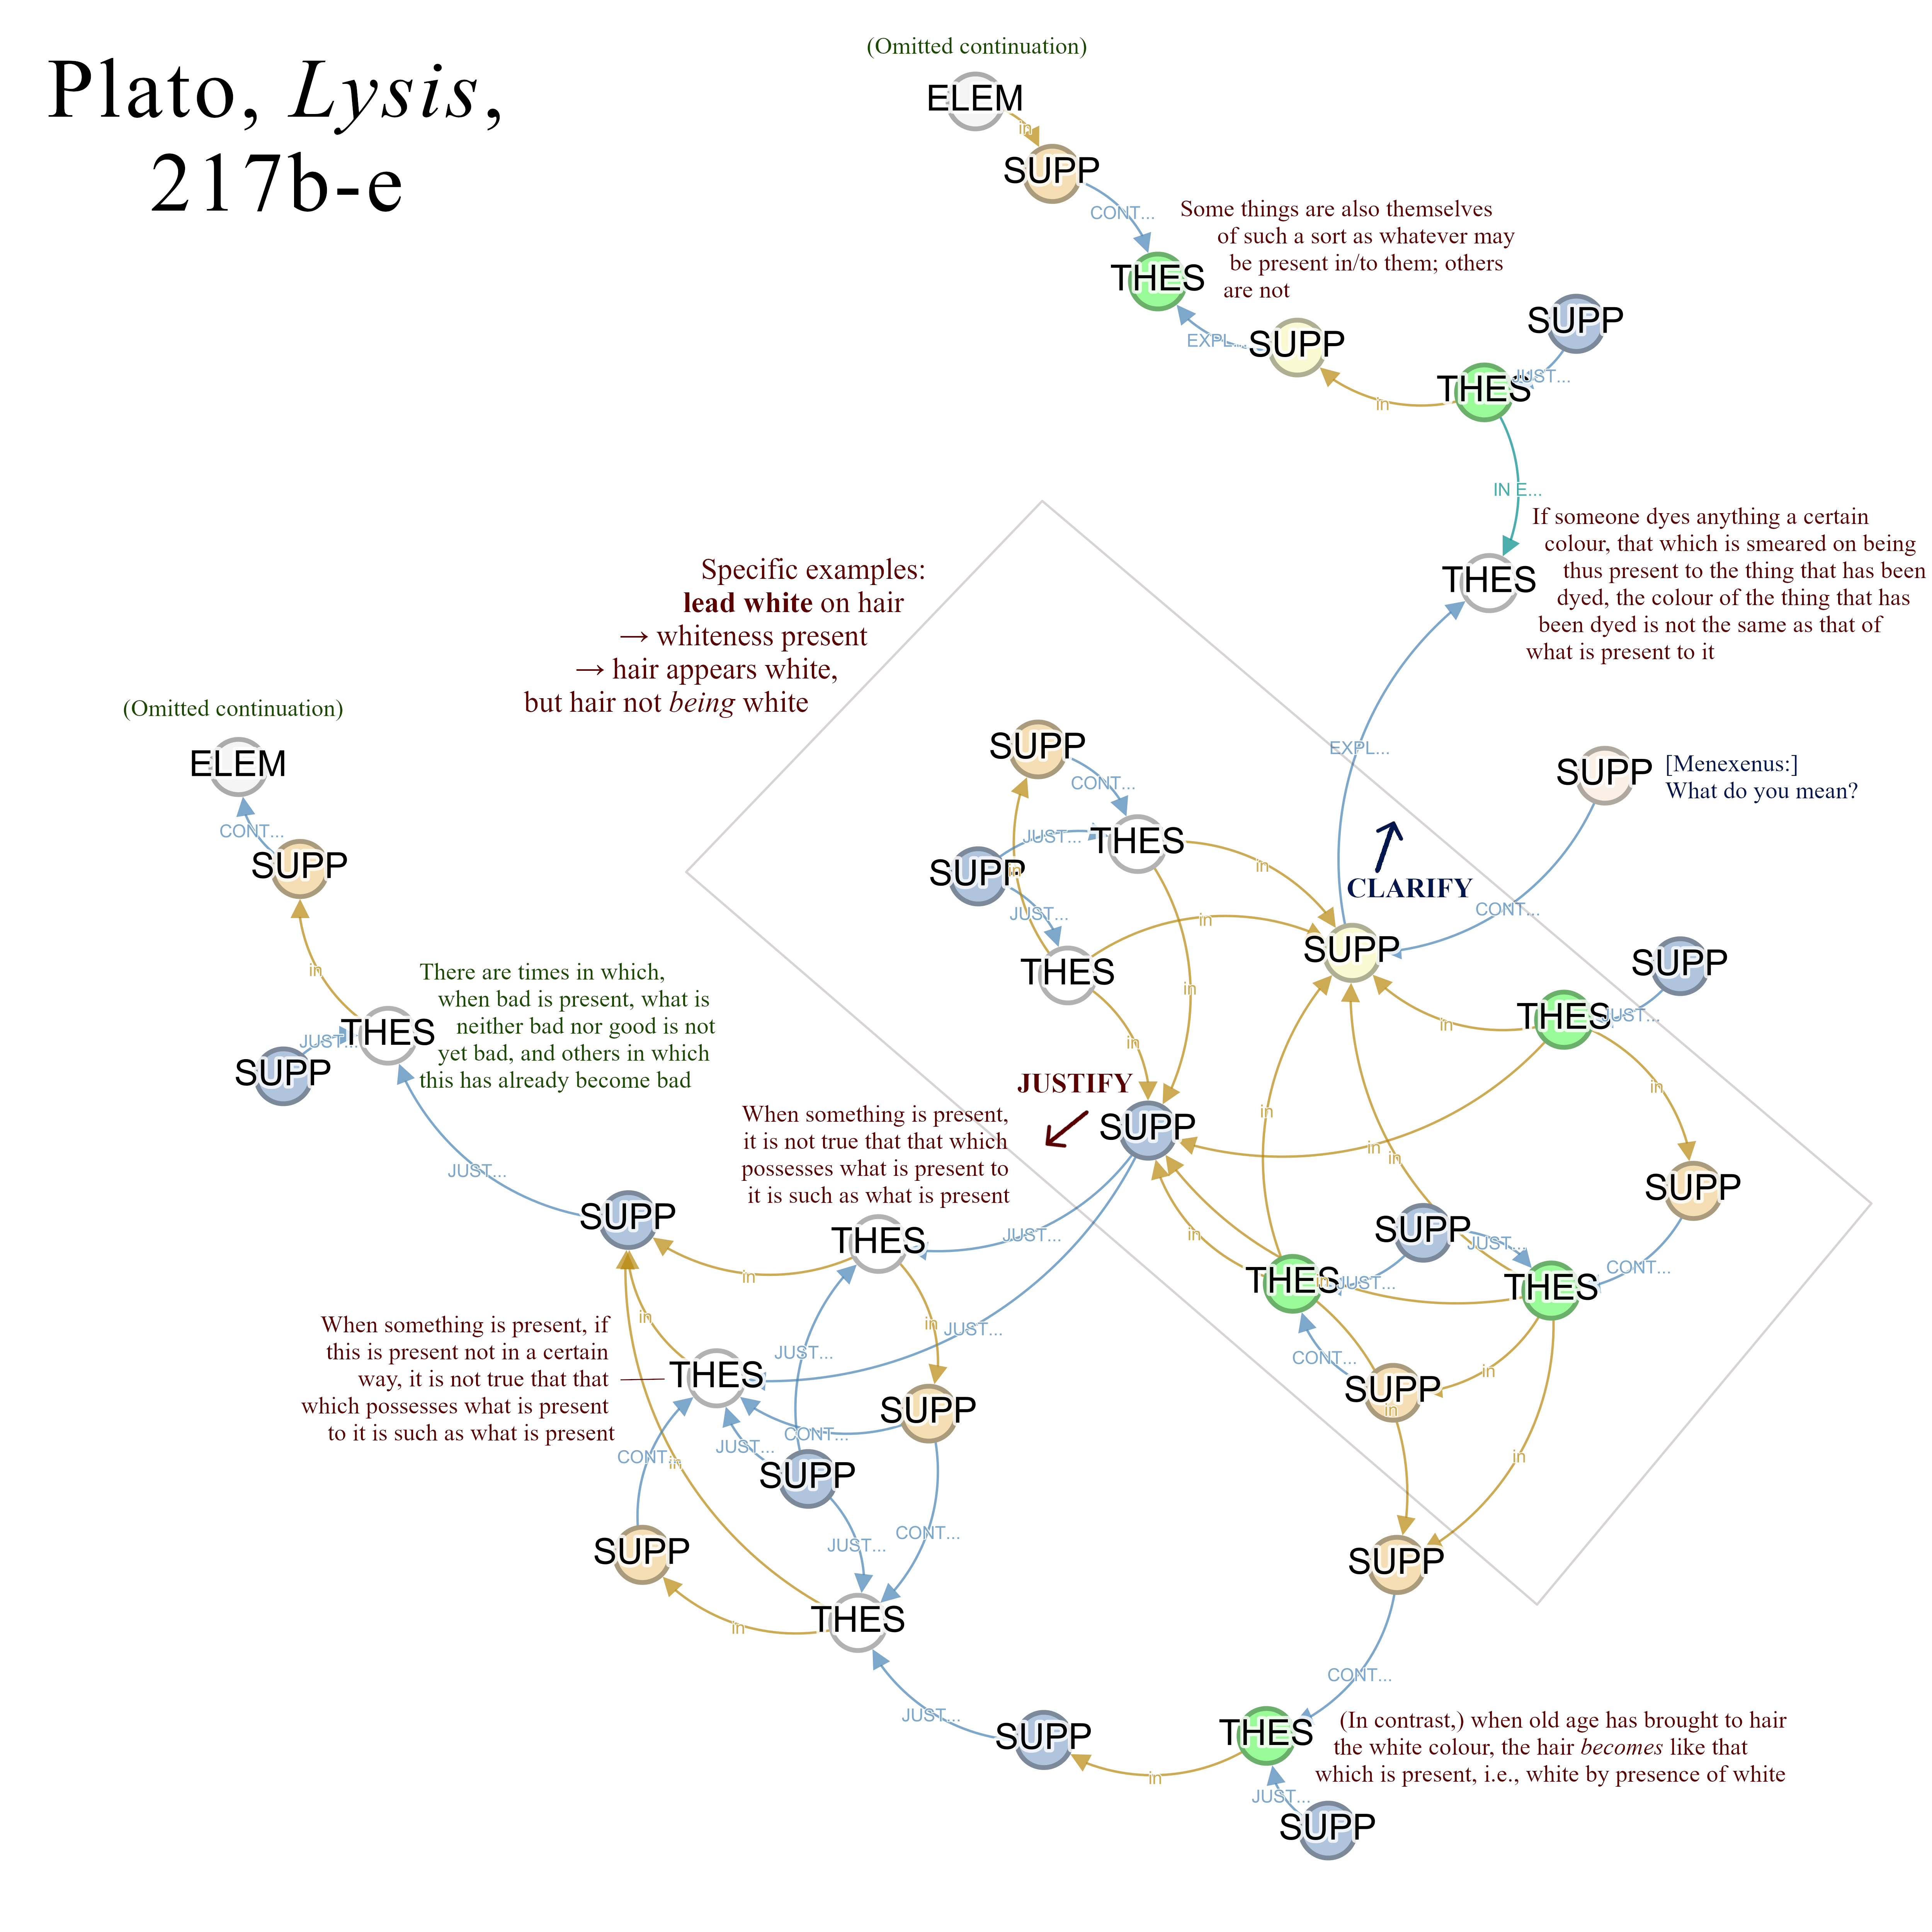
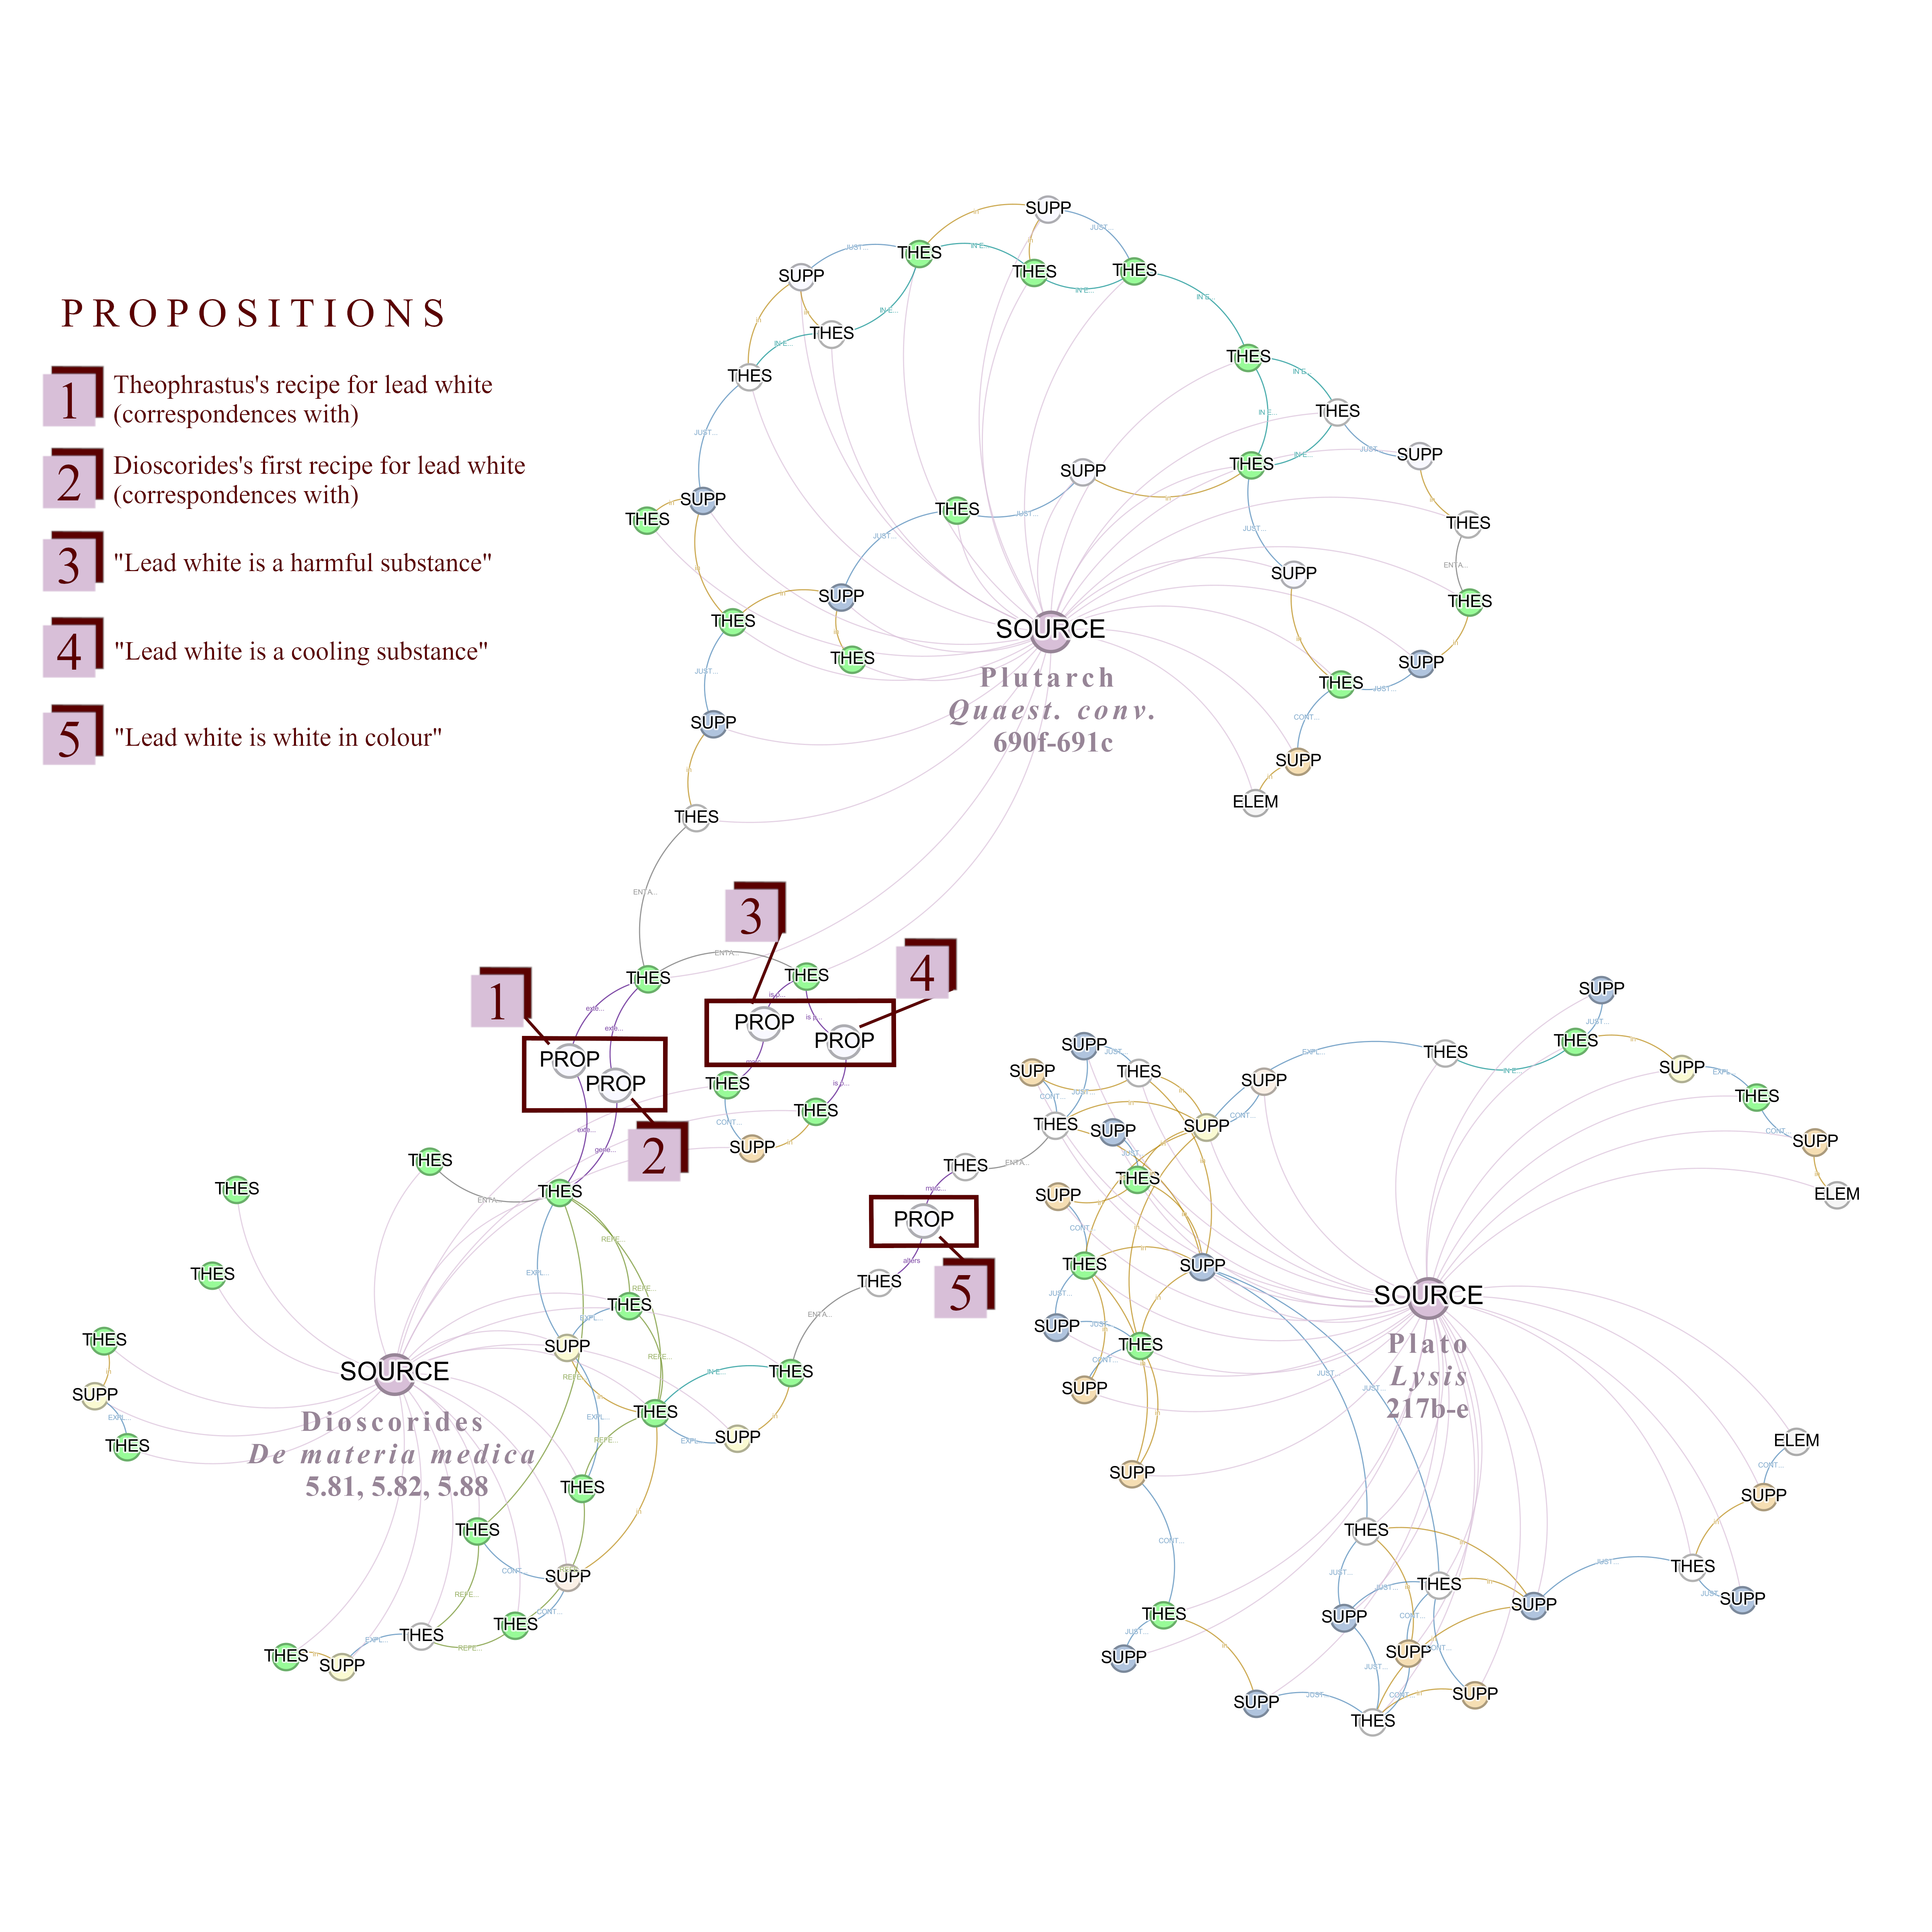
These hierarchical tree structures display extensive information directly on nodes: full paraphrases of theses, speaker attribution, passage references, and original text snippets. The layout arranges elements to show argumentative and expository dependencies—for example, premises appear above the conclusions they support.

Visual conventions distinguish different element types: explicit theses appear with solid borders, while implicit theses (reconstructed reasoning not directly stated in the source) use dashed borders. This makes the structure of arguments immediately apparent.

Best for: Analysing individual arguments, understanding how premises connect to conclusions, examining short passages in depth.

Generated with: Graphviz (dot engine or other layout engines)

THESIS Speaker · Passage Entailing thesis... "text snippet" ENTAILS THESIS Speaker · Passage Premise statement 1... "text snippet" impl. THESIS Speaker · Passage ( Implicit premise... ) THESIS Speaker · Passage Premise statement 2... "text snippet" EMPLOYED IN SUPPORT Speaker · Passage ref form: justification JUSTIFIES THESIS Speaker · Passage ref Target thesis (conclusion)... "original source text" Explicit thesis Implicit thesis Support Connector

Network Graphs

Purpose: Overviews, distant reading, and comparative analysis

These force-directed network graphs present a more abstract representation, with minimal information displayed directly on nodes. Users interact with the visualisation to reveal full details for individual elements. The layout algorithms position nodes so that spatial proximity indicates thematic similarity or connection.

This design is better suited to complex networks and cross-source comparisons, where hierarchical trees would become cluttered and difficult to read. Researchers can identify clusters, trace how ideas connect across sources, and discover patterns that emerge from the overall structure.

Best for: Viewing larger discourse structures, comparing ideas across multiple sources, identifying thematic clusters and influence networks.

Generated with: Gephi (ForceAtlas2 or Fruchterman Reingold layouts)

Example Visualisations

The following examples are drawn from a published dataset of TheSu XML annotations covering Greco-Roman sources on lead white. They demonstrate how each visualisation design works with real annotated data.

Detailed Argumentation Maps (Graphviz)

Argumentation Structure: Plutarch

This visualisation presents an argumentation example from Plutarch's Quaestiones convivales (6.5, 690f–691c). Plutarch's statement that "lead white is the most cooling of deadly drugs" is shown as included within a broader procedural observation about lead producing lead white when rubbed with vinegar. This serves as evidence for the claim that "lead is among the naturally cold substances". To make the logical progression explicit, an implicit mediating premise—that "lead can produce the most cooling of deadly drugs"—has been reconstructed and marked as 'entailed' by the procedural thesis.

Click to expand and explore the full map. Beyond the argumentation previewed here, the same passage contains additional annotated connections—particularly arguments relying on cause-and-effect relations between lead's properties and its cooling effects on water. As these connections multiply, the hierarchical tree becomes increasingly difficult to read. This is where the more abstract network graphs prove their value, showing the overall discourse structure at a glance.

Graphviz visualisation of Plutarch argumentation showing hierarchical tree with thesis-support relationships and explicit/implicit distinction

Recipe with Sequence Phases: Theophrastus

This visualisation demonstrates how TheSu XML handles procedural content—specifically, Theophrastus's recipe for lead white production from De lapidibus 55–56, which is the earliest attested production process for this substance. The recipe is broken down into its constituent phases, each with a full paraphrase, numbered and grouped in a cluster connected to the parent thesis node.

The integration of this view within the argumentation map ensures that the recipe's structure is revealed together with its discursive context. For instance, the thesis also includes the descriptive statement that lead "acquires thickness in a maximum of 10 days". Since this is not a procedural step but a physical observation, it cannot be annotated as a phase; however, it can be connected through an expository support to the relevant step ("they wait for lead to acquire thickness"), as shown in the visualisation.

Click to expand the full map. Depending on your window size, the preview may not show the numbered steps. The expanded view reveals the complete sequence of phases and their connections to the surrounding discourse.

Graphviz visualisation of Theophrastus recipe showing hierarchical tree with connected sequence phases

Network Graphs (Gephi)

Complex Discourse Structure: Plato

This visualisation presents a more complex discourse structure from Plato's Lysis (217b–e). In this passage, Socrates, in dialogue with Menexenus, reflects on the nature of qualities and their presence in objects. He uses examples involving the application of lead white to Menexenus's blond hair, repeating some points for emphasis and alternating between explicit statements and rhetorical questions (which convey 'implicit' theses). The lead white examples serve a dual purpose: they first function as expository supports, clarifying Socrates's unintuitive claim that a dyed object's colour differs from that of the dye present to it; then, they become argumentative premises supporting his ultimate moral point concerning the relationship between what-is-neither-good-nor-bad and badness.

The resulting discourse complexity makes hierarchical tree representations difficult to read. Many statements are presented as contrasting with each other (annotated with 'contextualising supports'), and Menexenus occasionally responds with confirmations (annotated as 'justifying supports'). The network graph format addresses this by showing how multiple theses, supports, and contextualising elements interconnect—revealing the overall structure at a glance.

Click to expand and explore the full graph. The captions, boxes, and arrows visible in the image were added manually for illustrative purposes—Gephi's native output displays only minimal node labels (element types like 'THES' and 'SUPP'), requiring mouse interaction to reveal full thesis paraphrases and relationship details.

Gephi visualisation of Plato discourse showing force-directed network with interconnected theses and supports

Cross-Source Comparison: Multiple Authors

This visualisation demonstrates how TheSu XML's proposition-based linking enables comparison across sources. Passages from Plato's Lysis (217b–e), Plutarch's Quaestiones convivales (6.5, 690f–691c), and Dioscorides's De materia medica (5.81, 5.82, 5.88) are connected through shared 'propositions'—abstract ideas that multiple specific theses represent. The network reveals thematic clusters: Plutarch's chemical-pharmacological discussion of lead white as a "deadly", "cooling" drug groups with Dioscorides's detailed medical and procedural account, while Plato's focus on the colour white connects with Dioscorides's remark that properly produced lead white "comes about white and effective".

The visualisation produces a perhaps surprising result: despite Plutarch's well-known Platonism, his discussion shares no common propositions with Plato's passage. Instead, both authors connect independently to Dioscorides—Plutarch through chemical and pharmacological content, Plato through chromatic observations. This approach can scale to larger corpora, where chemical-pharmacological discussions would cluster near Plutarch's, chromatic (and metaphysical) ones near Plato's, and encyclopaedic accounts like Dioscorides's would mediate between them.

Click to expand and explore the full graph. As with the Plato visualisation, the source labels, numbered proposition boxes, and guiding arrows were added manually for illustrative purposes—Gephi's native output displays only minimal node labels (element types like 'THES', 'SUPP', and 'PROP'), with full thesis paraphrases and relationship details accessible only through mouse interaction within the software.

Gephi visualisation of cross-source network showing Plato, Plutarch, and Dioscorides connected through proposition nodes

Future Development

The visualisations shown on this page are static images from a published dataset. A Python script was created to convert TheSu XML annotations into DOT files for Graphviz processing and Gephi import, producing both hierarchical argumentation maps and force-directed network graphs. This script is not yet publicly available—it requires further extension, restructuring, and polishing—but will be released as an open-source tool. Future versions will also generate Gephi-optimised GEXF files.

Several developments are planned to address current limitations:

  • Interactivity — Filtering by element type, speaker, theme, or source; decluttering methods for complex annotations; bidirectional linking so that selecting a graph node highlights the source text, and vice versa
  • Annotator GUI — A dedicated interface for creating TheSu XML annotations, with a first version planned for release by 2027, including direct text highlighting, contextual menus, and on-the-go visualisation generation
  • Web platform — Public access to interactive visualisations through a web browser, without requiring local software

For researchers interested in developing their own approaches, the machine-readable structure of TheSu XML supports conversion to standard graph formats and integration with various network analysis tools.